Ever wonder why a city can warn residents about a COVID‑19 surge before anyone shows up at the hospital? The secret isn’t magic—it’s the sewage. Wastewater testing COVID gives public‑health officials a sneak peek at community infection levels straight from the pipes.
In the next few minutes we’ll walk through how the science works, what the data actually tell us, and why it’s both exciting and a little tricky. Think of it as a friendly chat over coffee, where I’m sharing the inside scoop on a tool that could keep our neighborhoods safer.
What Is Wastewater Testing?
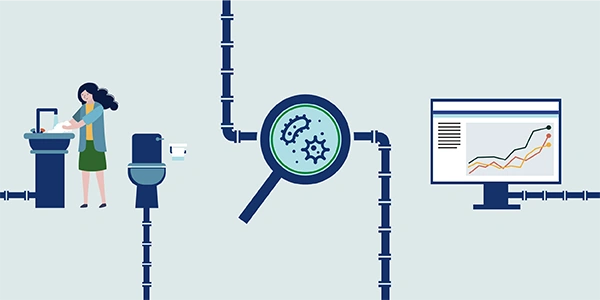
In simple terms, wastewater testing COVID looks for the genetic material of SARS‑CoV‑2 (the virus that causes COVID‑19) in the water that flows from our toilets, sinks, and showers. Even people who never feel sick shed bits of the virus in their stool, and those fragments travel down the sewer system.
According to the CDC’s National Wastewater Surveillance System, “people infected with SARS‑CoV‑2 can shed the virus in their feces, even if they don’t have symptoms.” That means wastewater is a collective health snapshot—one sample represents thousands of residents, symptomatic or not.
How Testing Works
Let’s break the process down into four easy steps, just like a recipe you might follow for a favorite dish.
Step 1 – Sampling Strategy
The CDC’s “Developing a Wastewater Surveillance Sampling Strategy” recommends three key decisions:
- Where to sample: At treatment‑plant influent points or smaller pump stations that serve a defined sewershed.
- How often: Ideally two to three times a week to catch rapid changes.
- What to collect: Composite samples that combine small volumes taken over 24 hours, giving a balanced picture of the whole day’s flow.
Think of it like taking a few spoonfuls from a big pot of soup at different times, then mixing them together so the flavor (or in this case, the virus signal) is evenly represented.
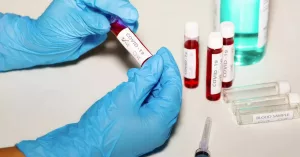
Step 2 – Lab Processing
After the sample lands in a certified lab, technicians walk through a series of carefully controlled steps (see the table below).
| Stage | What Happens |
|---|---|
| Sample preparation | Spiking a matrix recovery control to gauge how much material is lost during processing. |
| Concentration | Using ultrafiltration or PEG precipitation to pull viral RNA out of the huge water volume. |
| RNA extraction | Purifying the viral genetic material so it’s ready for measurement. |
| RT‑qPCR or digital PCR | Converting RNA to DNA and amplifying it to count copies of the N1 and N2 genes. |
Quality‑control is baked in at every step—labs run inhibition checks, human‑fecal markers, and known standards so the numbers are trustworthy.
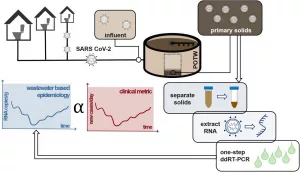
Step 3 – Turning Numbers Into Trends
Raw copies per liter don’t mean much on their own. Scientists normalize the data to the population served, adjust for flow rates, and then plot a rolling average on dashboards like the NWSS map. The result? A clear line that rises or falls, showing whether the virus is gaining ground or being pushed back.
Step 4 – Sharing With Decision‑Makers
Public‑health departments pull the trend data, compare it with clinical case counts, hospital admissions, and vaccination rates, and then decide whether to issue advisories, add testing sites, or boost outreach.
Why It Matters
Imagine you’re a school principal. One week, the local clinical case numbers look steady, but the wastewater data suddenly spikes 60 % above baseline. That early warning can prompt a temporary shift to remote learning, a pop‑up testing clinic, or an accelerated vaccine clinic—actions that could stop an outbreak before classrooms fill with sick kids.
Real‑world evidence backs this up. The CDC notes that wastewater can detect COVID‑19 “several days prior to reported cases.” In Seattle, researchers at the University of Washington used neighborhood pump stations to pinpoint emerging hotspots weeks before the city’s case dashboard lit up (2021 study). In Southern California, over 300 wastewater samples collected from nine treatment plants were correlated with community infection rates, proving that the signal is strong enough to guide public policy.
Balancing Benefits & Risks
Benefits You’ll Appreciate
- Early detection: 2‑14 days ahead of clinical reports.
- Cost‑effective: One sample represents thousands of residents, lowering per‑person testing costs.
- Inclusive: Captures asymptomatic and underserved populations who might never get tested.
- Variant tracking: Sequencing can spot new strains before they appear in patient samples.
Limitations to Keep in Mind
- Dilution in large plants: Bigger sewersheds can dilute the signal, making low‑level infections harder to spot.
- Variable shedding: Not everyone sheds the same amount of virus; the signal is an average, not an exact counts.
- False alarms: A sudden spike could be due to a storm flushing extra material, not a real surge.
- Privacy concerns: Although data are aggregated, some communities worry about “being watched” through their waste.
Because of these nuances, experts stress that “no public‑health action should be based solely on wastewater data.” It’s a powerful piece of the puzzle, but best used alongside clinical testing and other surveillance.
Public Health Uses
Here’s a snapshot of how agencies turn raw numbers into concrete actions:
- Data ingestion: NWSS uploads daily results to the CDC COVID Data Tracker.
- Threshold setting: Officials set trigger levels—e.g., a 30 % rise over the 7‑day average.
- Response activation: If the threshold is crossed, health departments may:
- Issue an advisory (“mask up, reduce gatherings”).
- Deploy mobile testing vans.
- Accelerate booster‑shot clinics.
In practice, a county in the Midwest halted a planned indoor concert after wastewater indicated a rising trend, buying time for vaccination outreach that likely prevented dozens of cases.
For more on the broader picture of COVID‑19 wastewater surveillance, check out our deep‑dive article on the topic.
Reading the Data Yourself
If you’re a curious citizen or a local planner, the NWSS dashboard is pretty user‑friendly. Here’s a quick cheat‑sheet:
- Select your region: Click the map or type your county.
- View the 15‑day rolling average: Smooths out daily fluctuations.
- Check the percent change: A rise of 20‑30 % often signals a genuine uptick.
- Compare with case counts: Look for alignment; diverging trends can be a red flag for testing gaps.
Want to take it a step further? Communities can set up their own monitoring program. The CDC’s guide suggests pairing “public‑health data needs” with a sampling plan, deciding on frequency, and budgeting for lab fees. It’s a bit of paperwork, but the payoff—real‑time insight—can feel like having a crystal ball for infection trends.
Read more about setting up a local program in our article on pandemic infection tracking.
Future Directions
Science never stops, and wastewater surveillance is evolving fast.
Variant‑Specific Sequencing
Next‑generation sequencing can decode the exact virus strain floating in the pipes. That means health officials could spot a new variant weeks before it shows up in patient tests, giving them a head start on vaccine updates and public messaging.
Integration With Other Environmental Sensors
Researchers are experimenting with linking wastewater data to air‑quality monitors, temperature sensors, and even traffic patterns. The goal? A holistic “pandemic watchtower” that flags potential spikes before they happen.
Community‑Driven Projects
Some cities are turning data into public art—interactive maps in libraries, live dashboards in town halls, and even school projects where students collect and analyze sample data. When people see the numbers in their own neighborhoods, the abstract threat of COVID becomes a tangible story they can act on.
For a look at how local data can feed into broader community COVID prediction models, stay tuned for our upcoming case studies.
Conclusion
Wastewater testing COVID isn’t a futuristic buzzword—it’s a proven, community‑wide early‑warning system that lets public‑health leaders act before hospitals are overwhelmed. By understanding how the virus travels from stool to sewer, how labs turn a sample into actionable trend data, and the strengths and blind spots of the method, you can interpret the numbers with confidence and know when to pair them with clinical testing, vaccination drives, or local advisories.
Keep an eye on the national NWSS map, follow CDC best‑practice guides, and remember that the secret truly is in the sewage—used wisely, it’s a powerful ally in fighting the pandemic.


Leave a Reply
You must be logged in to post a comment.