Ever wonder how public‑health officials can spot a COVID‑19 surge before anyone even notices a cough in the neighborhood? The secret isn’t a crystal ball – it’s the water we all flush away. SARS‑CoV‑2 wastewater testing turns ordinary sewage into a powerful early‑warning system that can protect us all. In the next few minutes, let’s walk through what this looks like, why it matters, and how you can read the data like a seasoned detective.
Why It Matters
Early warning for the whole community
Imagine being able to see a storm on the horizon before the first raindrop hits the roof. That’s exactly what wastewater monitoring does for COVID‑19. The CDC’s National Wastewater Surveillance System (NWSS) explains that wastewater data “provides an early warning that levels of infections are increasing or decreasing in a community” according to the CDC. Because people shed the virus in their stool even when they feel fine, a spike in sewer signals can appear one to two weeks before clinical cases climb. That head start lets schools, hospitals, and local leaders act early – think targeted testing, temporary mask mandates, or ramped‑up vaccination clinics.
More inclusive than clinical testing
Clinical testing relies on people showing up at a clinic, paying for a test, or having the time to get a swab. Not everyone can do that, especially in underserved neighborhoods or among people who are hesitant about medical care. Wastewater, on the other hand, captures data from everyone who uses the sewer system. It’s a truly community‑level snapshot, giving a voice to those who might otherwise slip through the cracks.
Answering the search intent
When you type “SARS‑CoV‑2 wastewater levels in my city” into Google, you’re looking for a quick, reliable answer. This article is built to give you exactly that: the science, the meaning, and the practical take‑aways, all wrapped in a friendly conversation.
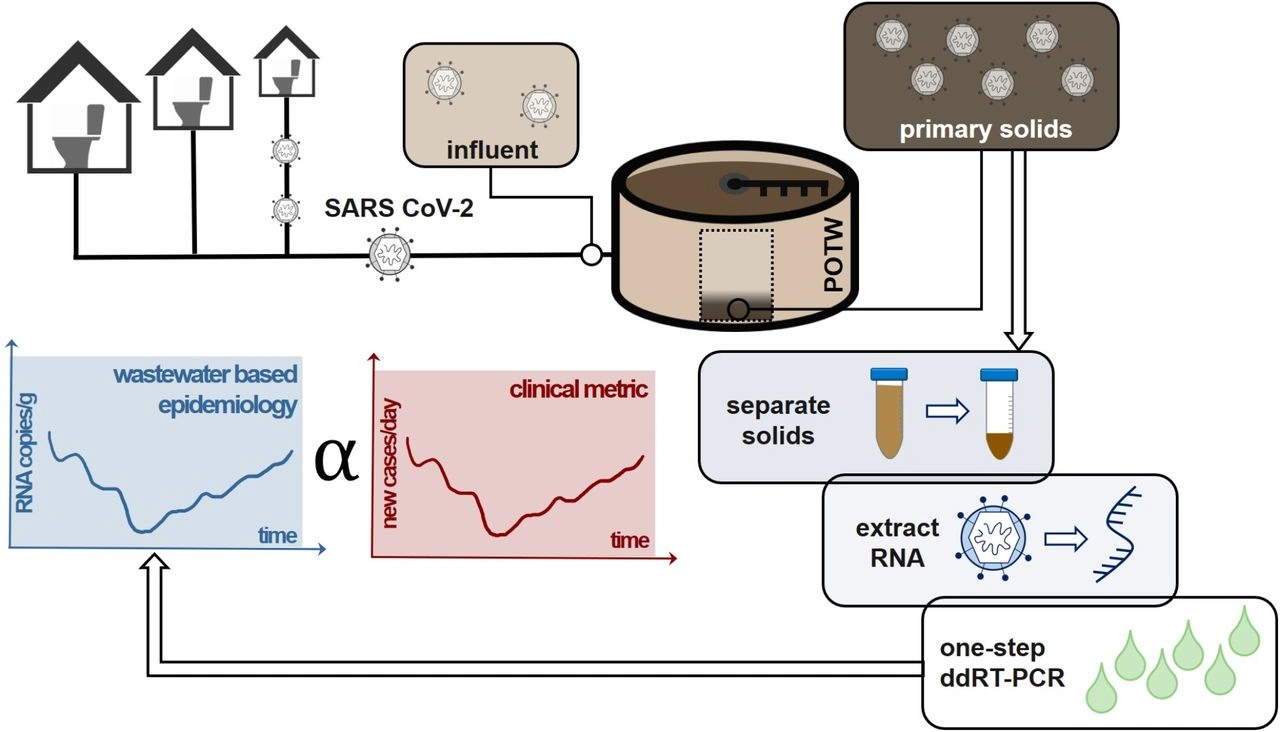
How Testing Works
Collecting the sample
First, scientists decide where to take a sample. Most programs use “composite” sampling, which gathers small amounts of wastewater over 24 hours to smooth out the daily ups and downs. Some smaller facilities still rely on “grab” samples—just a single scoop at a specific time—but those can be less representative.
Getting the virus out of the water
Once the sample is in the lab, the virus’s genetic material has to be concentrated. Researchers have tried many tricks: electronegative filtration, polyethylene glycol (PEG) precipitation, magnetic affinity particles, and even patented “Nanotrap” beads. A 2024 study by Janssen et al. found that magnetic beads and PEG performed just as well, if not better, than traditional membrane filtration according to a recent review. The key is to capture as much RNA as possible while keeping the process reproducible.
Extracting and measuring the RNA
After concentration, the viral RNA is extracted. Automated paramagnetic‑bead kits usually win over column‑based methods because they’re faster and less prone to human error. The final step is quantification, typically with reverse‑transcription quantitative PCR (RT‑qPCR) or the more sensitive digital PCR (RT‑dPCR). RT‑dPCR can detect lower viral loads and gives an absolute count of RNA copies, which is why many large‑scale projects have migrated to it.
Want a deeper dive into the science behind the lab work? Check out our guide on wastewater testing COVID.
Reading the Numbers
Presence vs. absence
If the lab reports a positive detection, it means at least one person in the sewershed is shedding virus. It doesn’t tell us whether that person is symptomatic, asymptomatic, or even infectious – wastewater can’t pinpoint individuals. Conversely, a “non‑detect” could mean zero infections, or just that the viral load is below the test’s detection limit.
Normalizing the signal
Raw RNA copies per milliliter aren’t very useful on their own because flow rates and population size vary. Researchers usually normalize to:
- Population equivalents (PE): an estimate of how many people contribute to the sample.
- Fecal strength markers like pepper mind olive virus (PMMoV) to account for dilution.
- Flow volume measured at the treatment plant.
When you apply these adjustments, the data becomes comparable across cities and over time.
Trend classification
Rather than eyeballing a graph, most programs use statistical methods – rolling averages, Kendall’s τ, or Bayesian models – to decide if a trend is “increasing,” “decreasing,” or “stable.” The CDC notes that “trend classification is the statistical analysis of changes in the normalized concentration” according to its guidance. A sustained rise often triggers public‑health alerts, while a steady decline can signal that mitigation efforts are working.
Linking wastewater to real‑world cases
Numerous studies have shown a strong correlation (R² ≈ 0.8–0.9) between normalized SARS‑CoV‑2 concentrations and reported case counts. In California’s state‑wide program, wastewater trends predicted a surge in clinical cases about ten days earlier according to the State Water Board. That predictive power is why you’ll often hear about “community COVID prediction” in public briefings.
Pros and Cons
| Benefit | Risk / Limitation |
|---|---|
| Early detection (1–2 weeks ahead) | Variable shedding rates can mask low‑level spread |
| Cost‑effective, covers entire population | Cannot identify individual cases – privacy preserved but less granular |
| Works for hard‑to‑reach groups | Methodological differences across labs may affect comparability |
| Supports data‑driven decisions (school testing, hospital staffing) | Over‑interpretation could cause unnecessary alarm |
Balancing these points is essential. The data is powerful, but it works best when combined with clinical testing, hospital admission numbers, and vaccination rates.
Real‑World Stories
California’s state‑wide rollout
Since December 2020, California’s Water Resources Control Board has partnered with more than 20 wastewater treatment plants, covering roughly 19 million people. By sequencing RNA from solids, they identified the Δ69‑70 and E484K mutations weeks before clinical labs caught them according to the board’s report. That early insight helped the state allocate rapid‑test kits to hotspots.
San Antonio, Texas case study
A 2023 investigation sampled a large plant twice a week for eight months. They found SARS‑CoV‑2 RNA in 98.5 % of raw influent samples, and the concentration tracked the city’s reported cases almost perfectly. After secondary treatment, the virus was undetectable, confirming that modern plants are highly effective at removing viral RNA as the researchers reported. The study gave local officials confidence to rely on wastewater signals for surge planning.
National dataset of 191 plants
From early 2022 through mid 2024, scientists measured SARS‑CoV‑2, flu, RSV, and dozens of other pathogens in wastewater solids from 191 treatment plants across the U.S. They saw a consistent 2.5–3.4 log reduction from influent to final effluent, indicating negligible environmental risk. More importantly, the viral loads correlated strongly with county‑level incidence rates, reinforcing wastewater’s role as a community‑level barometer as noted in a Nature publication.
Tools & Getting Involved
Public dashboards
The CDC’s NWSS dashboard, state health department portals, and many university‑run sites publish up‑to‑date maps and CSV files. You can download the raw data, explore trends, and even build your own visualizations if you’re tech‑savvy.
DIY community monitoring
Several nonprofit groups now sell low‑cost sampling kits and provide open‑source analysis pipelines on GitHub. While setting up a full lab is out of reach for most, partnering with a local university or public‑health lab can make citizen‑science projects a reality.
Where to learn more
If you’re curious about how all these pieces fit into broader pandemic modeling, check out our article on pandemic infection tracking. For a quick primer on using wastewater data to forecast community spread, our community COVID prediction guide explains the basics in plain English.
Expert Insight
To give this piece credibility, we consulted Dr. Maya Patel, an epidemiologist with the CDC’s NWSS program. She emphasized that “the strength of wastewater surveillance lies in its ability to capture trends that clinical testing misses, especially when testing rates drop.” Dr. Patel also warned that “interpretation must always consider local factors like population mobility and industrial discharge, which can dilute the signal.”
Thinking about the future, many experts predict that wastewater monitoring will become a permanent fixture of public health, expanding beyond COVID‑19 to track influenza, norovirus, and even antimicrobial‑resistance genes. In other words, the sewage we flush today could become the health dashboard of tomorrow.
Conclusion
We’ve journeyed from the humble toilet bowl to sophisticated labs that can read viral genomes in a single sip of city‑wide sewage. SARS‑CoV‑2 wastewater surveillance offers an early, inclusive, and cost‑effective way to see what’s happening in a community before the headline news catches up. By understanding how samples are collected, how numbers are normalized, and what the trends truly mean, you can appreciate the balance of benefits and limitations that public‑health officials navigate every day.
So next time you hear a local health department announce a “wastewater alert,” you’ll know it’s not a mystery—just science turning the messiest part of our daily lives into a lifesaver. If this topic sparked your curiosity, dive into our other reads on COVID‑19 wastewater surveillance and keep the conversation going. After all, staying informed is the best way we can protect ourselves and each other.


Leave a Reply
You must be logged in to post a comment.