
A “healthy” body mass index (BMI) typically falls between 18.5 and 24.9. Even so, BMI is not a universal measurement that applies equally to everyone.
Healthcare researchers frequently rely on BMI to monitor obesity trends across large populations. In clinical practice, doctors and other healthcare professionals also use it as a general screening method to evaluate an individual’s health status. Many women use a BMI calculator female tool to estimate where they fall within standard weight categories and to better understand potential health risks.
That said, the medical community has expressed concerns about using BMI as a sole indicator of obesity and overall health because it has notable limitations—particularly when evaluating Black and Hispanic individuals.
Even with these limitations, several health organizations continue to recommend staying within a certain BMI range as one strategy to lower the risk of chronic diseases such as cardiovascular disease and type 2 diabetes.
BMI chart and calculator
BMI does not differentiate between male, female, and intersex bodies. It is a mathematical formula based on height and weight that produces a number intended to estimate body fat levels.
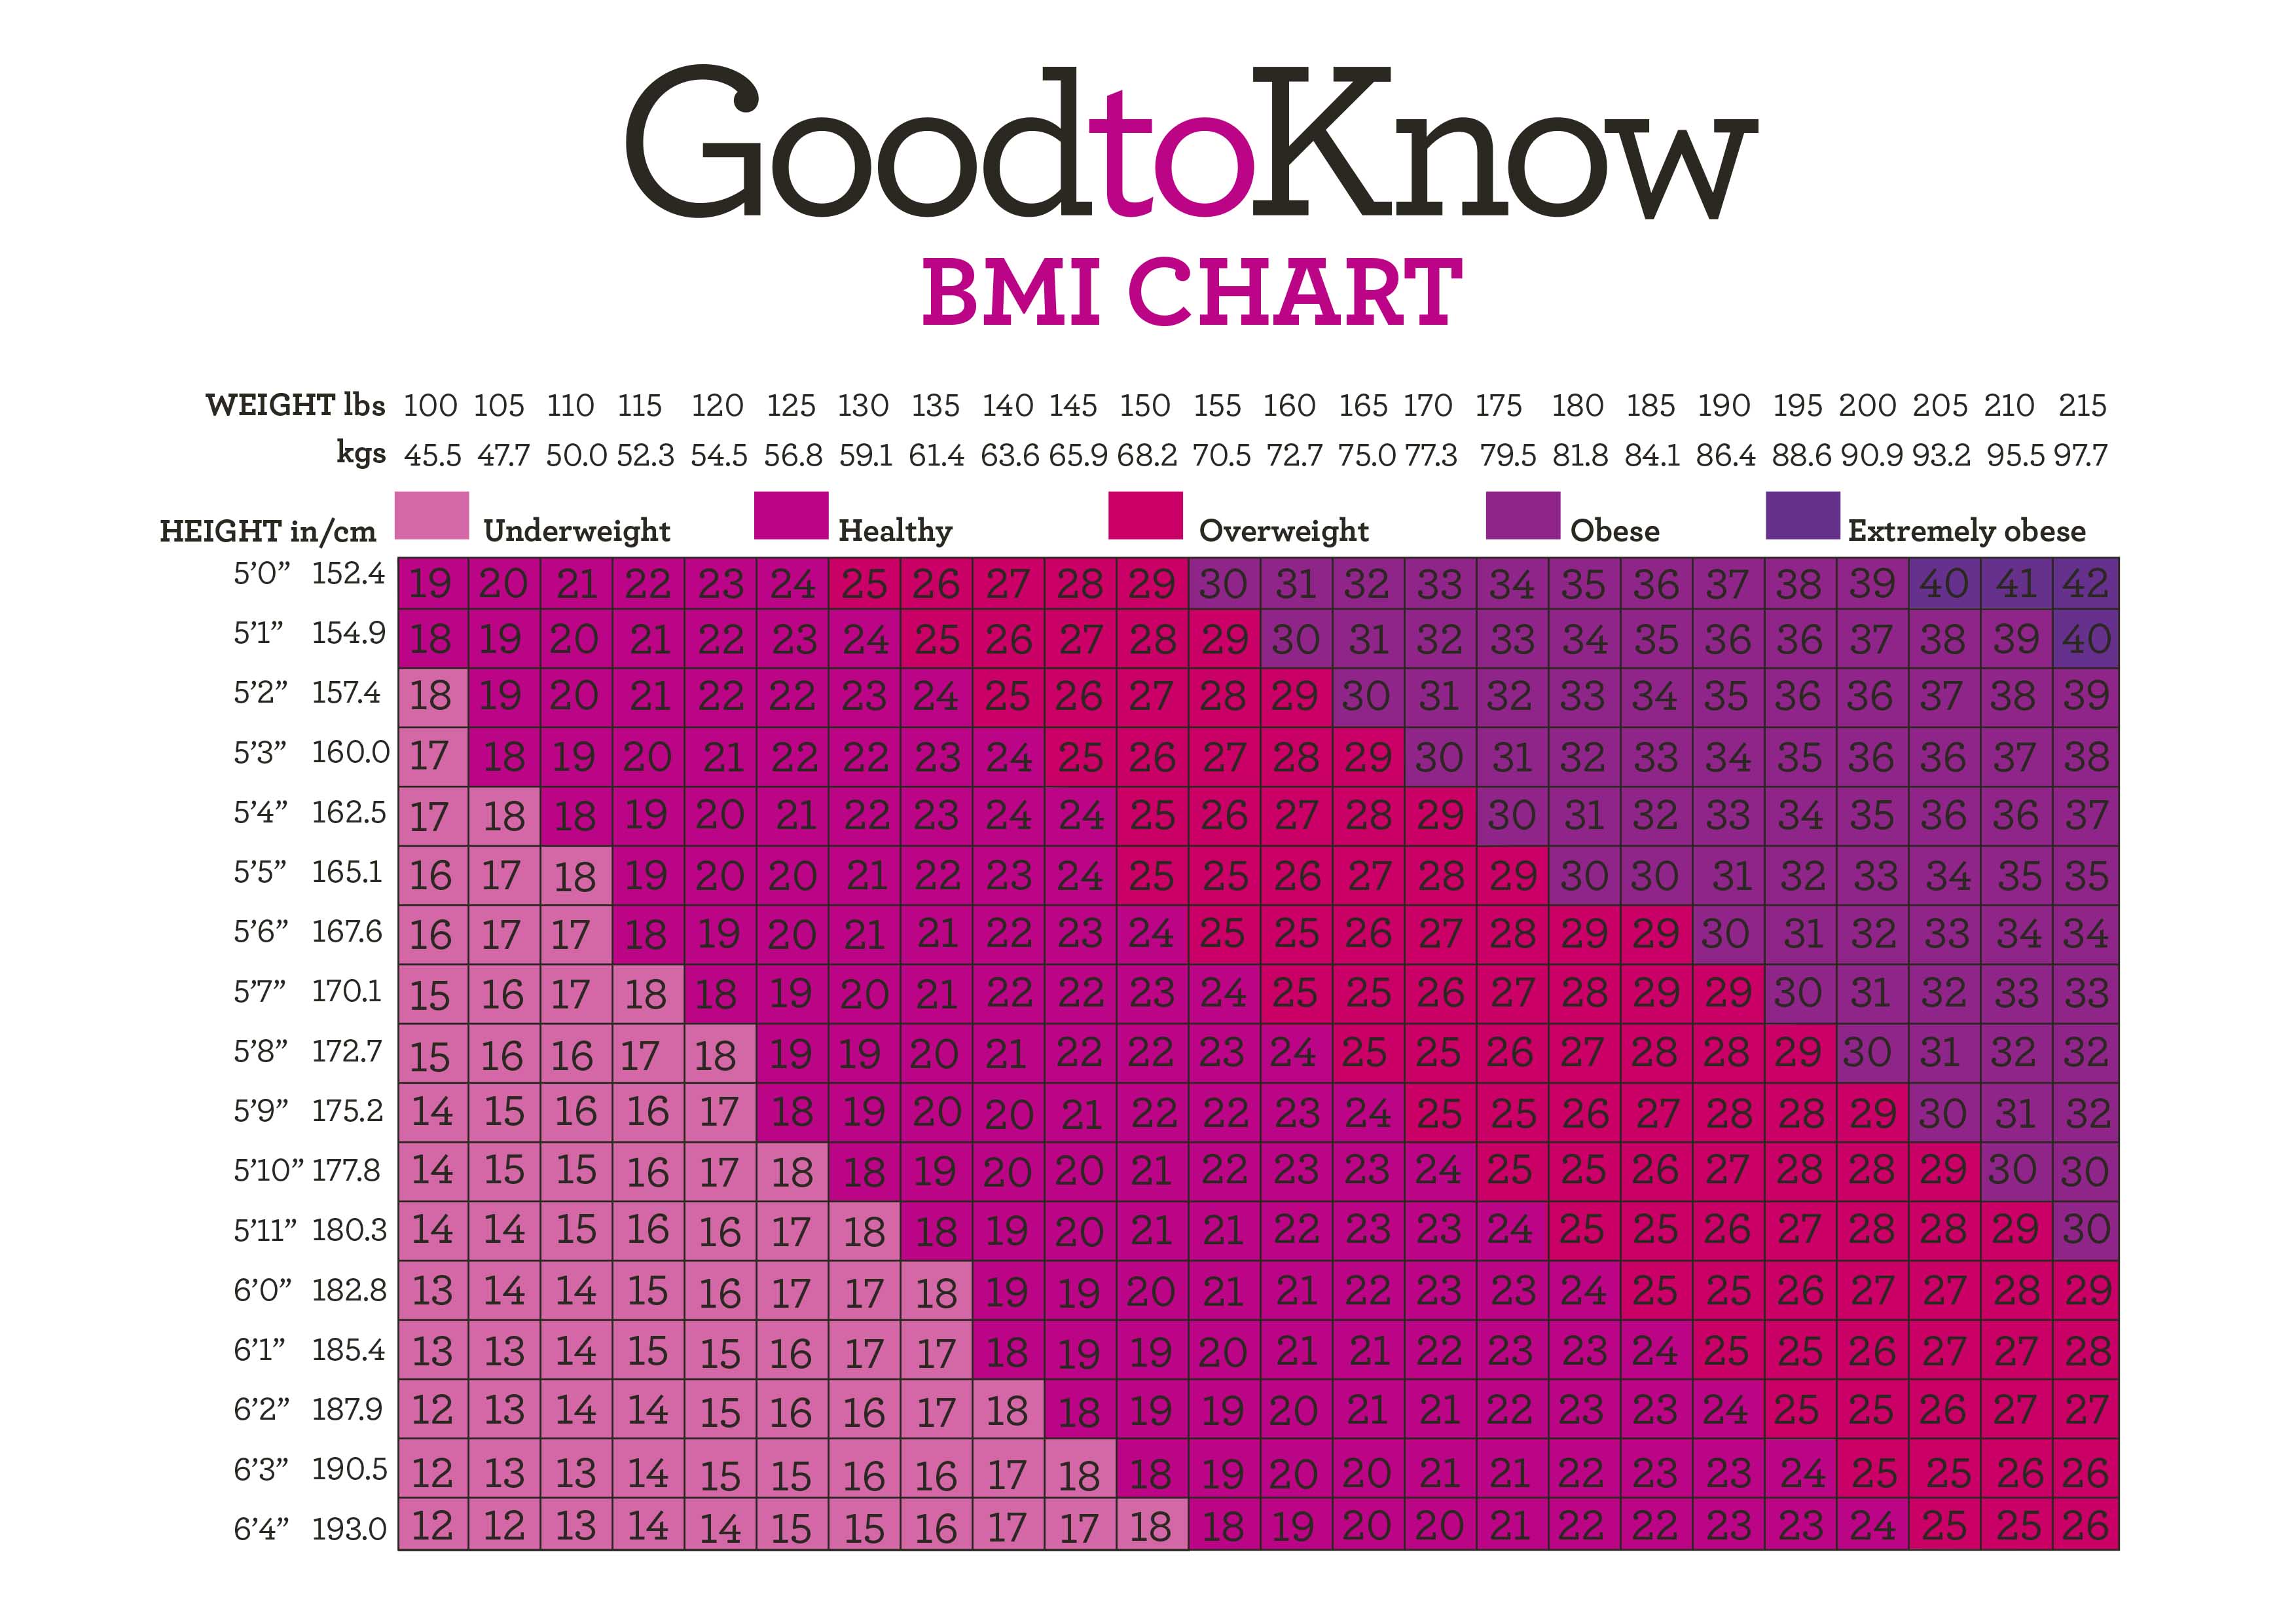
These numbers fit within the following categories:
| BMI range | Classification |
| less than 16.5 | severe underweight |
| less than 18.5 | underweight |
| 18.5–24.9 | healthy weight |
| 25.0–29.9 | overweight |
| 30.0–34.9 | obesity class I |
| 35.0–39.9 | obesity class II |
| 40 or greater | obesity class III |
You can use a BMI calculator female tool to estimate your BMI value. However, most standard calculators are not specifically tailored for cisgender women or people assigned female at birth. For more individualized assessments, some individuals explore tools such as a BMI calculator kg with age or a BMI calculator by age, which incorporate additional variables that may influence interpretation.
Clinicians may also apply alternative cutoff points depending on factors such as ethnicity, muscle mass, and overall body composition. This is especially relevant for athletic women or those with higher lean body mass, as BMI does not distinguish between fat and muscle.
The relationship between race, ethnicity, and female body composition
Race and ethnicity do not define a person’s weight, fat distribution, muscle proportion, waist circumference, or other physical characteristics. Each individual has a unique body composition.

Because BMI does not automatically account for racial or ethnic differences, some alternative cutoff values have been proposed, particularly for Asian and South Asian populations.
You’ll notice the language used to share stats and other data points is pretty binary , fluctuating between the use of “male” and “female” or “men” and “women.”While we typically avoid language like this, specificity is key when reporting on research participants and clinical findings.
White, Black, and Hispanic
Although a BMI between 18.5 and 24.9 is categorized as “healthy weight,” this classification does not reflect variations in body shape or composition.
Two individuals with identical BMI values may have substantially different distributions of body fat and muscle mass. For example, a 2015 review indicates that Mexican American adults often display different body fat patterns compared with non-Hispanic (NH) white or Black adults.
On average, Mexican American adults tend to have higher body fat percentages and greater waist circumference than white or Black adults.
NH Black adults generally have greater muscle mass compared with white or Mexican American adults.
Research has shown that healthcare professionals may be more likely to classify Black women as having obesity due to a higher proportion of muscle mass, even when overall health risk may differ.
Additionally, investigators note that the association between BMI and mortality risk is much weaker among Black women compared with white women. This underscores the importance of evaluating broader health markers rather than relying solely on BMI categories.
Asian and South Asian
Studies show that Asian and South Asian populations often have a higher percentage of body fat relative to body weight compared with white populations. Moreover, conditions such as type 2 diabetes may develop at lower BMI levels in these groups.
As a result, revised BMI cutoffs have been proposed for Asian populations. In one model, a BMI between 23 and 24.9 is considered overweight, while a BMI above 25 is categorized as obesity.
These differences highlight why women from diverse backgrounds may benefit from discussing BMI results with a healthcare professional who can interpret them in context.
The relationship between age, hormones, and female body composition
As women age, body composition naturally changes. Older adults typically experience a reduction in muscle mass and an increase in fat accumulation around the abdomen compared with younger adults.
These shifts are influenced by hormonal changes, reduced physical activity, and alterations in torso length associated with osteoporosis. Because BMI does not measure fat distribution, it may not fully capture these age-related transformations.
Hormonal fluctuations related to menopause can further affect the accuracy of BMI interpretations. A 2019 study involving 1,329 postmenopausal participants found that individuals categorized within a “healthy” BMI range could still meet criteria for overweight or obesity when more precise body composition assessments were used.
For this reason, midlife and older women may consider pairing a BMI calculator female result with additional measures, such as waist circumference, metabolic markers, and lifestyle evaluation, to gain a clearer understanding of health status.
The relationship between pregnancy and female body composition
During pregnancy, healthcare professionals advise gaining a specific amount of weight based on prepregnancy BMI. Using a BMI calculator female before conception can help establish a baseline for these recommendations.
Below are the Institute of Medicine reccomendations for total and trimester-specific weight gain in a singleton pregnancy:
| Prepregnancy BMI | Total weight gain | Rate of second and third trimester weight gain |
|---|---|---|
| underweight (under 18.5) | 28 to 40 pounds (12.5 to 18 kg) | 1 pound (0.51 kg) per week |
| normal weight (18.5 to 24.9) | 25 to 35 pounds (11.5 to 16 kg) | 1 pound (0.42 kg) per week |
| overweight (25 to 29.9) | 15 to 25 pounds (7 to 11.5 kg) | 0.6 pounds (0.28 kg) per week |
| obesity (30 or greater) | 11 to 20 pounds (5 to 9 kg) | 0.5 pounds (0.22 kg) per week |
Although these ranges provide general guidance, individualized care is essential. A healthcare professional can tailor recommendations based on overall health, nutritional needs, physical activity level, and any pregnancy-related conditions.
The bottom line
Researchers and clinicians recognize that BMI has important shortcomings. Nonetheless, it continues to serve as a practical and cost-effective screening tool for evaluating public health trends and identifying individuals who may benefit from further assessment.
While healthcare professionals may use BMI as an initial screening measure, it should not be the sole determinant of a woman’s body fat percentage or overall health. A comprehensive evaluation should include blood test results, dietary patterns, physical activity habits, sleep quality, and other lifestyle factors.
Using a BMI calculator female can be a helpful starting point for understanding weight categories and potential health risks. However, the most accurate insights come from discussing results with a qualified healthcare provider who can interpret them within the broader context of your unique physiology and medical history.
Wellos is owned by RVO Health. By clicking on this link, we may receive a commission. Learn more.


Leave a Reply
You must be logged in to post a comment.