Imagine you could peek inside a crowd of brains and see which parts light up when someone decides to buy a chocolate bar, falls in love, or feels a chill down their spine. That’s the promise of a brain associations study—a research adventure that links patterns in brain structure or activity to the things we do, think, and feel. In the next few minutes I’ll walk you through the basics, the clever tricks scientists use to make their findings trustworthy, and why the story matters to anyone curious about how the mind works. Grab a coffee, settle in, and let’s explore together.
Quick Start Summary
A brain‑wide association study (often called BWAS) examines whole‑brain MRI or functional scans to find statistical links between brain regions and behaviours or traits. The catch? Those links become reliable only when researchers use massive sample sizes, smart longitudinal designs, and clear statistical models. Below you’ll discover the three design secrets that boost replicability, the brain areas (like the amygdala) that most often pop up, and how everyday events leave fingerprints in our neural circuits.
What Is a Brain Associations Study?
At its heart, a brain associations study asks, “If we look at the brains of thousands of people, can we spot patterns that consistently match a particular behavior, such as risk‑taking, memory performance, or political preference?” Unlike studies that focus on a single region (say, only the hippocampus), BWAS scans the entire brain, letting the data tell us where the most meaningful connections lie.
Key terms you’ll hear:
| Term | Plain‑English |
|---|---|
| Effect size | How big the difference is between groups (big = easier to notice) |
| Replicability | Whether other researchers can get the same result with new participants |
| Longitudinal | Following the same people over time, not just a snapshot |
| Covariate | A variable like age or gender that you need to account for |
Design Matters More Than You Think
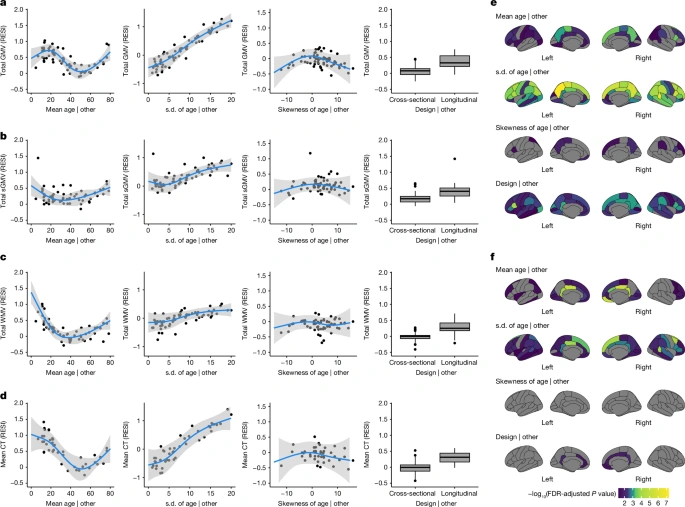
When I first read about brain‑wide studies, I imagined a handful of volunteers and a quick scan. The reality is far more demanding. A 2023 meta‑analysis that pooled 63 longitudinal and cross‑sectional MRI studies (over 77,000 scans) showed three pivotal design moves that dramatically increase standardized effect sizes and, consequently, replicability.
1. Bigger Samples, Bigger Confidence
Statisticians warn that brain data are noisy—tiny fluctuations can look like meaningful findings if you don’t have enough participants. That same meta‑analysis found that you need thousands of subjects to reliably detect effects smaller than 0.1 standard deviations. In plain language: the more brains you include, the clearer the picture. Think of it like trying to guess a city’s average temperature. Checking the forecast for one day will mislead you; pulling data from a whole year gives a trustworthy average.
2. Embrace Covariate Variability
Imagine you’re studying how age influences brain volume. If every participant is 20 years old, you won’t see any age effect. The Lifespan Brain Chart Consortium discovered that broad age ranges, as well as diverse educational and health backgrounds, inflate the standardized effect size. In other words, a study that samples a wide spectrum of people is more likely to spot real brain‑behaviour links.
3. Separate Within‑ and Between‑Subject Changes
Longitudinal designs are a gold mine because they let you watch how an individual’s brain changes over months or years. Yet many studies mistakenly treat the “average change across participants” as the same thing as “how each person changes.” A recent analysis showed that conflating these two reduces effect sizes—sometimes by half! The fix is simple: model the two sources of change separately, which lets you capture subtle yet consistent brain adaptations.
Design Checklist for a Robust BWAS
- Recruit at least 5,000 participants (or more if you expect tiny effects).
- Include a wide age range, balanced gender ratio, and varied socioeconomic backgrounds.
- Collect multiple scans per participant (e.g., baseline, 1‑year follow‑up).
- Use statistical software that distinguishes within‑subject from between‑subject variance.
- Pre‑register your analysis plan to curb “p‑hacking.”
Stars of the Show: Brain Regions That Keep Reappearing
Now that we’ve covered the blueprint, let’s look at the actors that often steal the spotlight in brain associations studies.
Amygdala – The Emotional Alarm Bell
The amygdala is a tiny almond‑shaped cluster deep in the temporal lobes. It’s best known for flagging threats, but it also nudges us toward rewarding choices, especially when emotions are involved. Research consistently links amygdala activity to “brain decision‑making amygdala” pathways—think of it as the brain’s gut feeling.
Want a deeper dive into why the amygdala matters? Check out this friendly piece on the amygdala role in everyday decisions.
Prefrontal Cortex – The Rational Commander
The prefrontal cortex (PFC) sits at the front of the brain and handles planning, impulse control, and weighing options. When the PFC receives “decision‑making stimuli”—whether a flashing advertisement or a complex moral dilemma—it integrates the information with emotional input from the amygdala to reach a verdict.
Curious about how different stimuli affect the PFC? Our guide on decision‑making stimuli breaks it down in everyday language.
Parietal and Hippocampal Regions – Memory & Spatial Skills
Studies of mathematicians, for example, have found increased gray‑matter density in the parietal cortex, a region that handles numbers and spatial reasoning. Similarly, the hippocampus, famous for forming new memories, often shows up in studies linking study‑time at home to brain growth.
Comparison Table
| Region | Typical BWAS Finding | Functional Meaning |
|---|---|---|
| Amygdala | Heightened volume/activity with emotional decision‑making | Threat detection, reward valuation, gut‑feel |
| Prefrontal Cortex | Stronger connectivity predicts better impulse control | Planning, reasoning, weighing options |
| Parietal Cortex | Increased gray‑matter in mathematicians | Numerical processing, spatial reasoning |
| Hippocampus | Growth linked to intensive study habits in children | Memory encoding, learning |
From Brain Structure to Real‑World Events
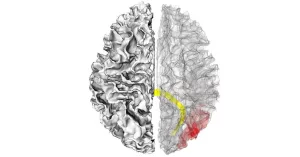
Ever wonder why a stressful exam can feel like a knot in your stomach? That sensation reflects a rapid cascade: external event → psychological response → transient brain activity →, over time, subtle structural change. Researchers call this the “brain‑links‑events” pathway. A longitudinal study of schoolchildren showed that more hours spent studying at home correlated with increased white‑matter volume in the right superior frontal gyrus—a region crucial for memory control.
If you’d like more concrete examples of how everyday experiences map onto brain anatomy, explore the brain links events article where we unpack studies ranging from music practice to marathon training.
Practical Take‑aways for Researchers and Curious Minds
Whether you’re a PhD student sketching your first BWAS or a health‑enthusiast wanting to read the headlines with a critical eye, these steps will keep you on solid ground.
Designing Your Own Study
- Start with power analysis. Plug in a modest effect size (e.g., 0.1 SD) and see that you’ll need thousands of participants.
- Recruit diversely. Age, gender, education, and health status should span a wide range.
- Plan longitudinal follow‑ups. At least two time points give you the ability to separate within‑ and between‑subject changes.
- Choose the right statistical model. Mixed‑effects models are the gold standard for handling repeated measures.
- Pre‑register. Publicly committing to your analysis plan deters selective reporting.
Interpreting Effect Sizes
In psychology, Cohen’s d = 0.2 is “small,” 0.5 “medium,” and 0.8 “large.” In brain‑wide work, because the data are noisy, a “large” effect often looks more like d = 0.1. Don’t be discouraged—these tiny effects can still be meaningful when they aggregate across many brain regions or predict real‑world outcomes.
Common Pitfalls & How to Dodge Them
- Over‑fitting. Using too many predictors relative to sample size spooks the model. Keep it parsimonious.
- Ignoring covariates. Age, head‑size, and scanner type can masquerade as brain‑behaviour links.
- Mis‑labeling within‑ vs. between‑subject change. Remember the point above—model them separately!
- Deterministic language. Never claim “the amygdala makes you fearless.” Instead, say “the amygdala is associated with heightened sensitivity to threat cues.”
Ethics, Transparency, and Trust
Brain research treads a fine line between curiosity and privacy. Open‑science practices—sharing raw MRI data (when consent allows), publishing analysis scripts, and documenting every preprocessing step—help the community verify results and build public trust.
At the same time, scientists must present findings with balance. Highlight the potential benefits (earlier detection of neurodegenerative disease, personalized education strategies) while acknowledging risks (over‑interpretation, stigmatization). By staying transparent, the field earns credibility and you, the reader, get a clearer picture of what the numbers really mean.
Key Insights Recap
To wrap things up, here are the three pillars that make a brain associations study both exciting and reliable:
- Massive, diverse samples. Bigger numbers tame noise.
- Smart longitudinal designs. Separate the story of each brain from the crowd.
- Clear, balanced interpretation. Let the data speak without overstating.
When you see headlines about “brain scans predicting political views” or “the amygdala controls your cravings,” remember the behind‑the‑scenes work that turns raw images into trustworthy knowledge.
Next Steps for You
If you’re feeling inspired, try these gentle actions:
- Read a recent open‑access BWAS paper and spot the sample size—does it meet the 5,000‑plus threshold?
- Take a moment to notice how everyday stressors (traffic, a heated debate) might be wiring your brain in subtle ways.
- Share the excitement with a friend. Explaining the concepts out loud deepens your own understanding.
And if you ever stumble on a brain‑related article that seems too sensational, ask yourself: Did the researchers use a large, diverse sample? Did they model within‑ and between‑subject change? Are they cautious about causality? That habit will keep you grounded in solid science.
Keep the Conversation Going
Brain science is evolving fast. New scanners, smarter AI‑driven analytics, and ever‑larger collaborative datasets (think UK Biobank and the Lifespan Brain Chart) promise richer insights every year. Stay curious, question the claims, and enjoy the journey of discovering how your own brain connects to the world.
Thanks for reading this deep‑dive with me. If you’ve got questions about a specific brain‑behaviour link or want tips on interpreting a scientific paper, feel free to reach out. Let’s keep learning together!


Leave a Reply
You must be logged in to post a comment.