Did you know that a single drop of wastewater can warn a whole city about a coming COVID surge before anyone feels sick? That’s the magic of pandemic infection tracking – a blend of science, technology, and a dash of teamwork that keeps us one step ahead of invisible enemies. In the next few minutes, I’ll walk you through how this works, why it matters, and what you can do to stay in the loop. Grab a coffee, settle in, and let’s dive into the world of real‑time disease detection together.
Why Tracking Matters
When a virus starts spreading, minutes matter. Early detection does more than just add a number to a chart – it can save lives, protect economies, and keep our daily routines humming. Public‑health officials rely on pandemic infection tracking to spot hidden spikes, decide when to tighten or ease restrictions, and allocate resources like ventilators or vaccines where they’re needed most.
According to the CDC’s COVID Data Tracker, a sustained test‑positivity rate above 5 % often precedes a rise in hospitalizations. That tiny percentage is a silent alarm that stops a wave before it crashes onto our hospitals.
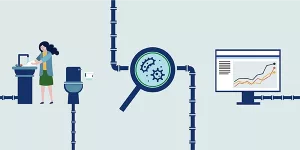
Core Tracking Tools
Wastewater Surveillance – The Early‑Warning System
Imagine our city’s plumbing as a giant bloodstream. When people shed the virus in their stool, it ends up in the sewer, and scientists can detect its genetic fingerprint. This is what we call wastewater testing COVID. By sampling sewage at treatment plants, concentrating viral RNA, and running a quick RT‑qPCR, labs can estimate how many people are silently infected.
Why is this so powerful? A single wastewater sample can give a community‑wide snapshot without needing anyone to get tested. In the Netherlands, for example, researchers spotted the Omicron variant in sewage two weeks before the first clinical case was reported. That extra lead time meant local officials could roll out pop‑up testing sites and reinforce mask mandates, blunt‑ing the surge.
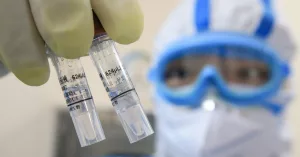
Clinical Testing & Genomic Sequencing
Traditional testing – the nasal swabs and rapid antigen kits – still matters. They confirm who’s actually sick and feed data into national dashboards. But the real kicker is sequencing the virus’s genome from each positive sample. By tracking mutations, we can see new variants appear and spread, just like watching ripples on a pond.
When the Delta variant first emerged, sequencing data helped the WHO and CDC update vaccine guidance within weeks. Those quick pivots saved countless lives.
Digital & Mobility Data
Our phones know a lot about where we go. Aggregated, anonymized mobility data tells scientists if people are staying home, returning to offices, or crowding into concerts. AI models combine these movement patterns with case numbers to predict where the virus might jump next.
A study in The Lancet Infectious Diseases showed that blending mobility trends with clinical data improved community COVID prediction accuracy by 30 % (Dong et al., 2020). That’s the kind of synergy that turns raw numbers into actionable insight.
Traditional Epidemiological Indicators
Hospital admissions, ICU occupancy, and seroprevalence surveys (like the blood‑donor studies run by the CDC) remain essential. They validate what the wastewater and digital signals are telling us, creating a robust safety net of overlapping data sources.
How Data Integrates
Centralized Dashboards
All these streams flow into user‑friendly dashboards. The CDC’s COVID Data Tracker, Johns Hopkins’ Coronavirus Resource Center, and Our World in Data present interactive maps, trend lines, and heat maps that anyone can read.
For a deeper dive, check out our own COVID‑19 wastewater surveillance page, where we overlay clinical case curves with wastewater viral loads for several U.S. cities.
Data‑Sharing Partnerships
Global cooperation is the glue that holds everything together. The WHO’s Global Influenza Surveillance and Response System (GISRS) now includes SARS‑CoV‑2, allowing labs worldwide to upload sequencing data in near‑real time. Meanwhile, academic‑government consortia blend cutting‑edge research with public‑health logistics, making sure the latest findings hit the streets fast.
Machine‑Learning Fusion
Think of machine learning as the orchestra conductor, turning many noisy instruments into a harmonious melody. By feeding wastewater viral loads, test positivity, mobility trends, and hospital data into sophisticated algorithms, models generate “community COVID prediction” alerts that warn officials when infection rates are likely to rise in the next 7‑10 days.
Our own community COVID prediction tool does exactly this – it crunches the numbers and flashes a simple “green, yellow, red” status for each county, so local health departments can act quickly.
Benefits of Tracking
Faster Outbreak Detection
Wastewater can give a 3‑7‑day heads‑up before clinical cases surface. That’s the time needed to ramp up testing, inform the public, and mobilize medical supplies.
Targeted Public‑Health Interventions
Because the data is localized, officials can send mobile testing vans to a specific zip code instead of blanket statewide campaigns. Precision saves money and reduces “pandemic fatigue” among residents who don’t feel singled out.
Resource Optimization
Vaccines, antiviral pills, and ICU beds are finite. By knowing where spikes are brewing, hospitals can pre‑position staff and equipment, and vaccine distribution can focus on hotspots, ensuring the right people get protection when they need it most.
Improved Public Trust
Transparent dashboards show “what we know” and “what we’re doing.” When people see real‑time data, they’re more likely to follow guidance because they understand the rationale.
Risks & Challenges
Data Quality & Representativeness
Not every community has a centralized sewage system. Rural areas might rely on septic tanks, making wastewater sampling harder. Plus, sampling frequency and lab methods can vary, introducing bias.
Privacy Concerns
Mobility data and genomic sequencing can feel intrusive. Strict anonymization and clear data‑use policies are essential to keep public confidence high.
Operational Costs
Running labs, maintaining samplers, and hiring data scientists isn’t cheap. Funding must be sustained, especially when a pandemic seems “over” to policymakers.
Interpretation Errors
Relying on a single indicator can cause false alarms. That’s why multi‑source integration is the gold standard – it balances out the noise.
Real World Case Studies
| Location | Tools Used | Outcome | Lesson |
|---|---|---|---|
| Netherlands (2021) | Wastewater & Clinical Testing | Detected Omicron 2 weeks early | Early‑warning works across variants |
| UC San Diego Campus | Campus wastewater + AI model | Targeted testing prevented outbreak | Granular data → rapid response |
| Atlanta, GA | Mobility + Hospital Data | Adjusted surge‑capacity, avoided ICU overload | Multi‑data integration yields actionable insights |
Notice how each success story blends at least two data streams. That’s the recipe for reliable forecasting.
Follow Tracking Locally
Want to stay in the know about what’s happening in your neighborhood?
- Check local dashboards. Most state health departments embed CDC or Johns Hopkins maps on their websites.
- Subscribe to alerts. Many cities now send SMS or email notifications when wastewater viral loads cross a threshold.
- Participate in testing. If your area rolls out pop‑up testing because of a wastewater signal, jump in – you’re helping the data become even more accurate.
- Read trusted sources. Stick to data from the CDC, WHO, or peer‑reviewed journals. If you’re curious about how scientists measure virus in sewage, our SARS‑CoV‑2 wastewater article breaks it down in plain English.
Future Tracking Trends
Standardized Global Wastewater Protocols
The WHO is drafting universal guidelines for sampling, processing, and reporting. When every country follows the same playbook, we’ll be able to compare data across borders instantly.
Real‑Time Genomic Surveillance in Sewage
Scientists are already sequencing viral fragments straight from wastewater, meaning they can spot new mutations before they even show up in patients. Imagine a world where a new variant is flagged in a lab in Singapore and the alert pops up on a dashboard in New York within hours.
Edge‑Computing Sensors
Portable devices that detect RNA on‑site could cut lab turnaround from days to minutes. Early pilots in Denmark have shown that on‑site sensors can trigger a public‑health response the same day a spike is recorded.
Privacy‑Preserving Data Analytics
Tech firms are developing “federated learning” models that train AI on decentralized data without ever moving the raw numbers. This protects individual privacy while still improving prediction accuracy.
Conclusion
Pandemic infection tracking is like a massive, invisible safety net woven from wastewater, test results, phone signals, and smart algorithms. It gives us a precious early warning, guides precise interventions, and helps keep our hospitals from being overwhelmed. At the same time, we must stay vigilant about data quality, privacy, and costs, ensuring the system remains trustworthy and inclusive.
By keeping an eye on local dashboards, signing up for community alerts, and participating in testing when asked, you become an active part of this lifesaving network. Together, we can turn data into deeds and protect the health of our neighborhoods, cities, and the world.


Leave a Reply
You must be logged in to post a comment.