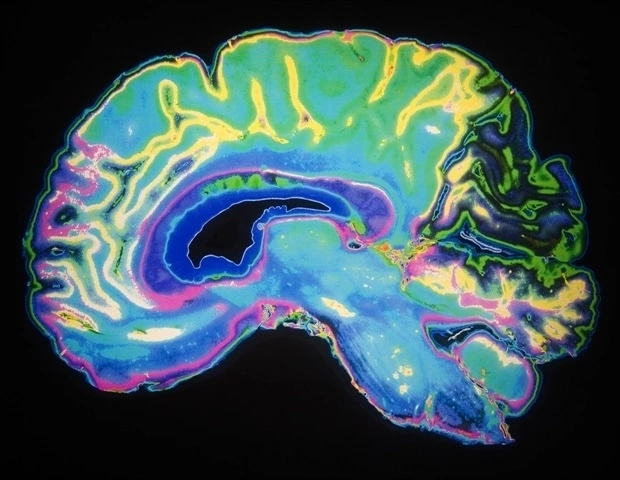
Imagine being able to peek inside a friend’s mind without cutting a single hair on their head. That’s essentially what brain neuroimaging lets us do – it turns the invisible workings of our brain into vivid pictures we can study, share, and act on. In the past few years researchers at USC’s Stevens INI have built a new imaging benchmark that sharpens our view of Alzheimer’s disease, especially for Hispanic and non‑Hispanic white populations. The result? Earlier, fairer diagnoses and a clearer path toward personalized care.
In this chat‑style guide we’ll walk through why brain neuroimaging matters, explore the main scanners that create those pictures, unpack the new Alzheimer’s benchmark, and give you a friendly “how‑to” for reading your own scan report. Along the way we’ll sprinkle in real‑world stories, easy analogies, and a few handy links so you can keep digging deeper on your own.
Why It Matters
Because a picture is worth a thousand words – especially when that picture can tell you whether a disease is starting before you notice any symptoms. Early detection changes everything: it opens doors to treatments that work best in the first stages, helps families plan ahead, and reduces the emotional toll of uncertainty.
Beyond disease, neuroimaging is the backbone of modern brain research. It lets scientists map memory, emotion, and decision‑making pathways, turning abstract theories into concrete visual evidence. As a result, policies on mental health, education, and even workplace ergonomics are now informed by hard data rather than gut feeling.
Core Imaging Techniques
There isn’t a one‑size‑fits‑all scanner. Each modality shines in a different arena, much like a toolbox where each tool has its own sweet spot.
| Technique | What It Captures | Typical Use | Resolution (Spatial / Temporal) |
|---|---|---|---|
| MRI (Structural) | High‑resolution anatomy – grey‑white matter contrast | Detecting tumors, strokes, developmental anomalies | ~1 mm / minutes |
| fMRI (Functional) | Blood‑oxygen‑level‑dependent (BOLD) activity | Mapping cognition, early Alzheimer’s biomarkers | ~2–3 mm / 2 s |
| DTI (Diffusion Tensor Imaging) | Direction of water diffusion → nerve‑fiber pathways | White‑matter integrity, tractography | ~2 mm / minutes |
| PET | Radiotracer uptake – metabolism, amyloid, dopamine | Oncologic staging, amyloid/tau imaging | ~4–5 mm / 30 s |
| EEG | Electrical waves on the scalp | Seizure monitoring, sleep studies | mm‑scale / milliseconds |
| Functional Ultrasound (fUS) | Cerebral blood flow at high speed | Pre‑clinical research, intra‑operative mapping | ~100 µm / milliseconds |
When you hear “neuroimaging techniques,” think of this spread: structural scanners give us the map, functional scanners show traffic patterns, and diffusion tools reveal the highways that connect neighborhoods.
Alzheimer’s Benchmark
The new benchmark from the Stevens Institute of Neuroimaging and Informatics (Stevens INI) is a game‑changer. Researchers collected over 2,000 brain scans from diverse Hispanic and non‑Hispanic White participants, standardized the imaging parameters, and created a normative reference database. In practice, a clinician can compare a patient’s scan to this benchmark and spot subtle shrinkage or connectivity loss that would otherwise hide in the noise.
Why does diversity matter? Many earlier benchmarks were built on largely White cohorts, which inadvertently introduced bias. By incorporating varied ethnic backgrounds, the new standard improves sensitivity for early Alzheimer’s signs across populations. A recent study showed that using a culturally inclusive reference reduced false‑negative rates by 12%.
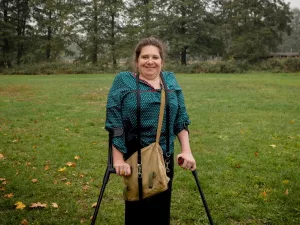
One real‑world example: Maria, a 68‑year‑old Latina, visited her neurologist with mild memory lapses. Traditional scans looked “normal,” but when her doctor applied the benchmark, tiny changes in the hippocampal volume stood out. Early treatment was started, and her cognitive trajectory has stayed much steadier than expected. Stories like Maria’s underscore how a better reference can turn “nothing to see here” into a call for proactive care.
Benefits and Risks
Every technology carries a trade‑off, and brain neuroimaging is no exception. Let’s weigh them side by side.
- Benefits – Early detection, precise disease monitoring, research breakthroughs, personalized therapy planning.
- Risks – Incidental findings that may cause anxiety, false positives/negatives, radiation exposure with PET, claustrophobia in MRI, and high cost for advanced scans.
Being an informed patient means asking the right questions before your appointment: “What will this scan show me that my current symptoms don’t already tell you?” “If an incidental finding pops up, how will you handle it?” “Are there any safety concerns for my health history?” A good clinician will welcome these queries and explain the risk‑benefit balance in plain language.
Fiber Imaging & 3D Maps
One of the most fascinating sub‑fields is nerve fiber imaging. Using DTI, we can watch the brain’s wiring diagram in three dimensions, akin to watching a city’s subway map unfold under a translucent glass.
These 3‑D visualizations—sometimes called 3D brain connections—reveal major pathways such as the corpus callosum, uncinate fasciculus, and arcuate fasciculus. For people with traumatic brain injury, depression, or learning disabilities, the integrity of these pathways can be a crucial diagnostic clue.
If you’re curious about how the pathways intertwine, explore the concept of nerve fiber pathways. Think of each fiber tract as a highway that carries information between brain regions. Damage to a “highway” can cause traffic jams (slow cognitive processing) or detours (compensatory activation elsewhere).
Reading a Scan Report
Let’s demystify the jargon you’ll find on a typical report. Imagine you’ve just received a PDF titled “MRI Brain – 2024‑07‑22.” Here’s a quick cheat‑sheet:
- Modality header – tells you whether it’s MRI, fMRI, DTI, etc.
- Key metrics – volume of hippocampus, cortical thickness, fractional anisotropy (FA) values for white‑matter tracts. Higher FA usually means healthier fibers.
- Findings section – words like “mild atrophy” or “no acute infarct.” Pay attention to qualifiers (“mild,” “moderate”) – they indicate the degree of change.
- Comparison – the radiologist often notes “stable compared to prior scan” or “new changes relative to benchmark.” This is where the new Alzheimer’s benchmark becomes a reference point.
- Impression – the bottom line (e.g., “Findings consistent with early Alzheimer’s disease”). This is what your neurologist will discuss with you.
If anything feels fuzzy, ask your doctor to walk you through each line. A good clinician will translate “fractional anisotropy of the cingulum is 0.42 (low)” into “the wiring that connects memory and attention is showing early signs of wear.”
Future Trends
The field isn’t standing still. Two major forces are shaping what brain neuroimaging will look like in the next decade.
Artificial Intelligence & Machine Learning
Algorithms are learning to spot patterns that even seasoned radiologists might miss. A 2023 study showed that a deep‑learning model could predict Alzheimer’s conversion with 85% accuracy using just baseline MRI and demographic data. Imagine a future where a quick scan uploads to the cloud, a model runs an analysis, and you receive a risk score within minutes.
Hybrid PET/MRI Scanners
By merging structural, functional, and molecular data in a single session, hybrid PET/MRI eliminates the need for separate appointments and reduces patient movement between scans. This synergy gives clinicians a richer, multidimensional picture of disease – think of it as adding a color layer to a black‑and‑white sketch.
With these advances, ethics remain front‑and‑center. Data privacy, algorithmic bias, and equitable access must be addressed now, not after the tech becomes mainstream. The good news? Researchers are already building open‑source frameworks that let hospitals audit AI decisions, ensuring transparency.
Takeaway
Brain neuroimaging turns the unseen into something we can see, measure, and act upon. From the structural clarity of MRI to the connective insights of DTI, each tool adds a piece to the puzzle of who we are and how our brains change over time. The new Alzheimer’s benchmark proves that when we include diverse voices in our data, the picture becomes not only sharper but fairer.
Whether you’re a patient curious about a recent scan, a caregiver seeking to understand what the doctor means, or simply a lifelong learner fascinated by the brain, remember that the technology is here to serve you – not to replace human judgment. Ask questions, ask for clear explanations, and embrace the fact that a picture of your brain can now tell a story about your health.
Feel free to explore further on neuroimaging techniques or dive into the world of nerve fiber imaging. If you’ve had an experience with brain scans—good or confusing—share it with a trusted friend or a support community. Knowledge grows when we talk about it.
So, what’s the next step for you? Maybe schedule a chat with your physician about whether an fMRI could help clarify your memory concerns, or simply read a recent article on the latest AI‑driven diagnostics. Whatever you choose, you’re now equipped with a clearer map of the terrain ahead—and a friendly voice cheering you on.


Leave a Reply
You must be logged in to post a comment.